xyz-hls
Use HERE Location Services Routing to navigate to features in an XYZ Space
Introduction
Duration is 3 min
This codelab will walk you through combining HERE XYZ and HERE Location Services to create an interactive routing application. Using a public data source of drinking fountains in Seattle, the user of the application will be able visualize the path from a specified starting location to a drinking fountain location. The drinking fountain dataset will be stored in an XYZ Space.
The result of this tutorial will be an interactive map application rendered with Leaflet and Tangram.
This codelab demonstrates the use of multiple HERE products:
What is the Geocoder API?
The Geocoder REST API enables developers to convert street addresses to geo-coordinates and vice-versa with forward geocoding, including landmarks, and reverse geocoding.
What is the Places API?
The Places (Search) API is a REST API that allows you to build applications where users can search for places and receive detailed information about selected places.
What is a HERE XYZ Space?
HERE XYZ is an open, interoperable and real-time location data management service from HERE Technologies that offers simple APIs, SDKs, components, and interactive tools that enable everyone to make maps easier and faster.
An XYZ Space is a real-time cloud-based location hub for discovering, storing, retrieving, manipulating and publishing private or public mapping data.
What you’ll need
- a HERE Developer account for leveraging location APIs
Grabbing data from the open data website
Duration is 3 min
To get started, download the Seattle Drinking Fountain dataset from Seattle’s Open Data Website.
Click on the export button in the top right, and then the GeoJSON link.
Alternatively, you can download the file directly from this link.
Move the file into your project’s directory. For convenience, I renamed the file fountains.geojson
Uploading data to an XYZ Space
Duration is 12 min
The first task we’ll accomplish is uploading the data to an XYZ Space. XYZ Spaces, part of the XYZ Hub API, are powerful geospatial databases that can store millions of rows. A great benefit about XYZ Spaces, is that they automatically tile the data; meaning that the data can be queried efficiently for map display.
For more information about XYZ Spaces, take a look at the documentation.
There are many ways to upload data to an XYZ Space:
- via REST API
- via XYZ Studio
- via the HERE Command Line Interface (CLI)
I prefer the CLI because of its ease of use. To install the CLI, run the command:
npm install -g @here/cli
(At anytime if you get lost during CLI installation, feel free to visit the XYZ CLI tutorial.)
Next, configure your credentials by running:
here configure set
When prompted, enter your app id/code from the HERE Developer Portal.
The next step is to create a new XYZ Space with the following command:
here xyz create -t "Seattle Drinking Fountains" -d "Locations of drinking fountains throughout Seattle"
The -t and -d options are for the space’s title and description.
Upon completion, the here xyz create command will a success message like:
xyzspace 'zgsrj7y4' created successfully
Be sure, to copy the id in quotations–we’ll be using this in a future step.
To upload the data to the space, use the following command:
here xyz upload YOUR_SPACE_ID -f foundatins.geojson
Be sure to replace YOUR_SPACE_ID with the space id that was outputted when you created the space with the here xyz create command.
Now is also a good time to grab your XYZ token. To see your available tokens, run the following command:
here xyz token
Keep one of these tokens handy–we’ll be using it in future steps.
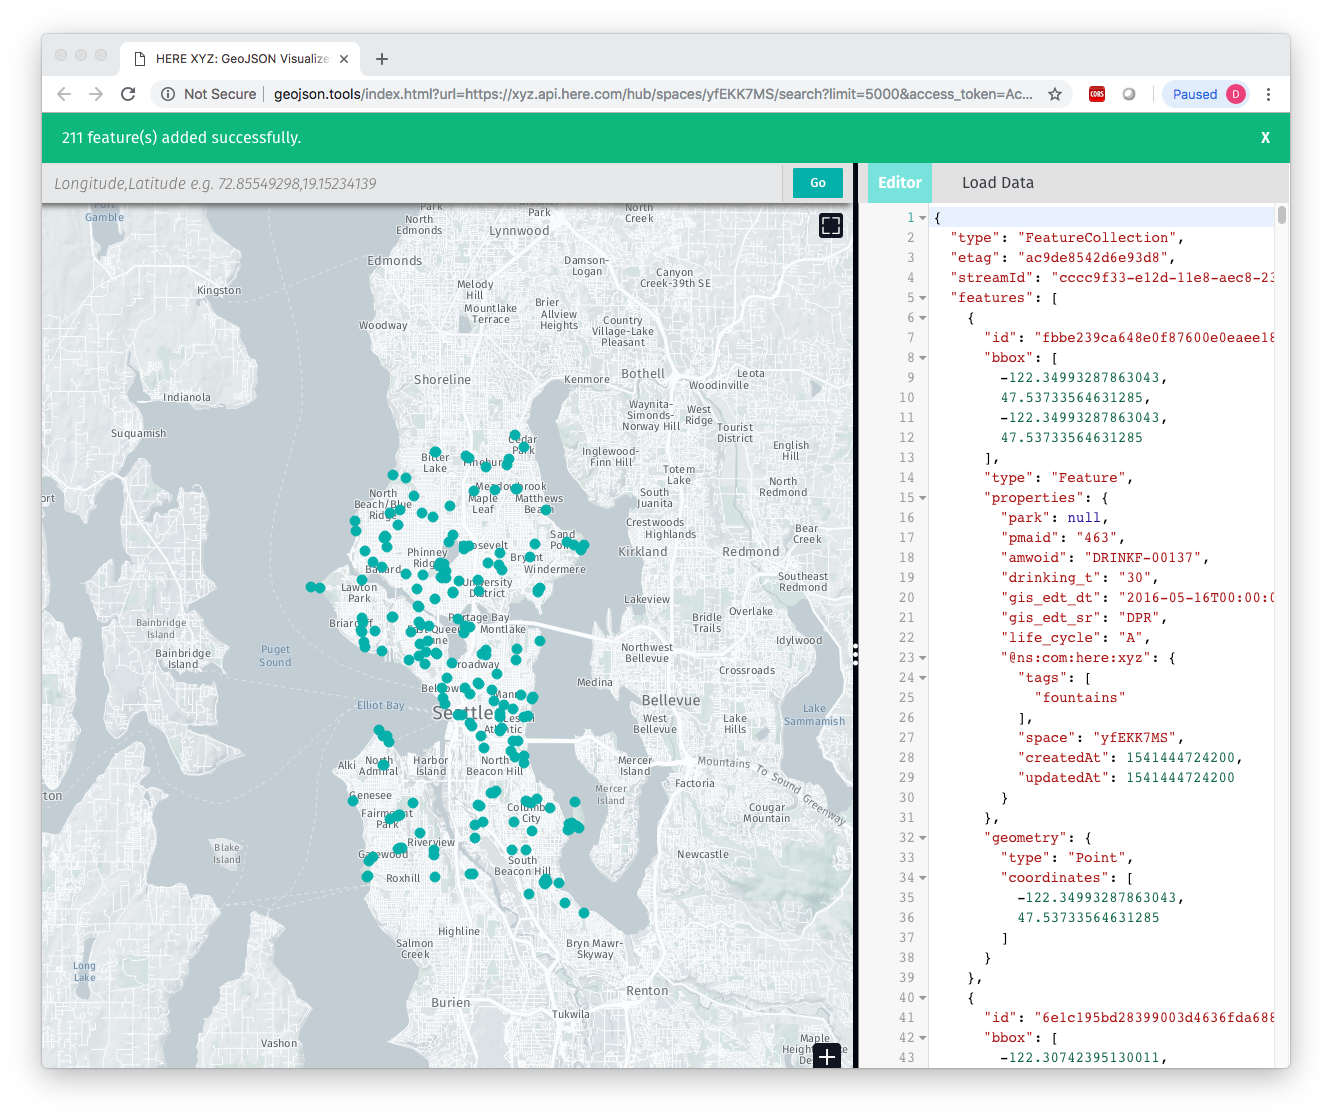
Congrats! We’ve now created a new XYZ Space and uploaded data. To verify you’ve successfully created the space, you can run the following command:
here xyz show YOUR_SPACE_ID -w
This command will open up the space in the HERE XYZ GeoJSON viewer:
Setting up HTML, JavaScript and CSS skeleton
So far we’ve uploaded data to our XYZ Space, now let’s begin creating our web application skeleton.
By the end of this step, you will have created 3 files in your project directory:
index.htmlstyle.cssindex.js
Create a new index.html file with the following code:
<html>
<head>
   <title>Seattle Drinking Fountains</title>
   <link rel="stylesheet" href="style.css">
   <script src="https://unpkg.com/leaflet@1.0.1/dist/leaflet.js"></script>
   <script src="https://unpkg.com/tangram/dist/tangram.min.js"></script>
   <script src="https://cdn.jsdelivr.net/gh/IvanSanchez/Leaflet.Polyline.SnakeAnim/L.Polyline.SnakeAnim.js"></script>
   <link rel="stylesheet" href="https://unpkg.com/leaflet@1.0.1/dist/leaflet.css" />
</head>

<body>
   <div id="control">
      <h3>Seattle Drinking Fountains Routing</h3>
      <p>
         Starting position
      </p>
      <input type="text" value="701 Pike St Seattle" id="start" />
      <button id="change-start">Change</button>
      <p>
         Routing options
      </p>
      <form id="routing-mode" action="">
         <input type="radio" name="routing-mode" id="walking" value="pedestrian" checked> Walking<br>
         <input type="radio" name="routing-mode" id="driving" value="car"> Driving
      </form>
      <button id="clear">Clear polylines</button>
   </div>
   <div id="map"></div>
   <script src="index.js" type="text/javascript"></script>s
</body>
</html>
In the above code, we’ve configured the template for:
- a map, with the div of id
map. - a control sidebar, with the id
control. The sidebar is where we can configure options for the routing and map view.
As for the CSS, create a new file titled style.css with the following code:
body {
   margin: 0px;
   border: 0px;
   padding: 0px;
   font-family: sans-serif;
   color: #333;
}

#map {
   height: 100%;
   width: 100%;
   position: absolute;
}

#control {
   width: 300px;
   height: 100%;
   position: absolute;
   top: 0;
   left: 0;
   background-color: white;
   z-index: 1000;
   padding: 15px;
}
Last but not least, create a file titled index.js with the following code:
const here = {
   id: 'HERE-APP-ID',
   code: 'HERE-APP-CODE'
};

const map = L.map('map', {
   center: [47.608013, -122.335167],
   zoom: 13,
   layers: [
      Tangram.leafletLayer({
         scene: 'scene.yaml',
         events: {
            click: onMapClick
         }
      })
   ],
   zoomControl: false
});

async function onMapClick() {
   //We will write code in here later...
}
The above code initiates the Leaflet map with a Tangram vector layer. Don’t try to run the project yet–it is still missing some components.
Additionally, be sure replace HERE-APP-ID and HERE-APP-CODE with your own credentials obtained on the HERE Developer Portal.
Configuring the Tangram layer
Duration is 5 min
So far, we’ve uploaded data to the XYZ Space and carved out our web application’s basic code skeleton. In this section, we’ll focus on getting our Leaflet/Tangram map up and running.
Go ahead and create a new file scene.yaml. A YAML scene file is a file Tangram uses to interpret map styling rules. In this file, we’ll be configuring styling rules that not only style cartography objects like parks, roads and builings, but also our very own drinking fountain data.
Go ahead and paste the following into the scene.yaml file:
cameras:
    camera1:
        type: perspective

lights:
    light1:
        type: directional
        direction: [0, 1, -.5]
        diffuse: .3
        ambient: 1

sources:
    xyz_osm:
        type: MVT
        url: https://xyz.api.here.com/tiles/osmbase/256/all/{z}/{x}/{y}.mvt
        max_zoom: 16

layers:
    earth:
        data: { source: xyz_osm }
        draw:
            polygons:
                order: function() { return feature.sort_rank; }
                color: '#ddeeee'

    landuse:
        data: { source: xyz_osm }
        draw:
            polygons:
                order: function() { return feature.sort_rank; }
                color: '#aaffaa'

    water:
        data: { source: xyz_osm }
        draw:
            polygons:
                order: function() { return feature.sort_rank; }
                color: '#88bbee'

    roads:
        data: { source: xyz_osm }
        filter:
            not: { kind: [path, rail, ferry] }
        draw:
            lines:
                order: function() { return feature.sort_rank; }
                color: gray
                width: 8
                cap: round
        highway:
            filter:
                kind: highway
            draw:
                lines:
                    order: function() { return feature.sort_rank; }
                    color: '#cc6666'
                    width: 12
                    outline:
                        color: grey
                        width: 1.5
        minor_road:
            filter:
                kind: minor_road
            draw:
                lines:
                    order: function() { return feature.sort_rank; }
                    color: lightgrey
                    width: 5

    buildings:
        data: { source: xyz_osm }
        draw:
            polygons:
                order: function() { return feature.sort_rank; }
                color: lightgrey
        3d-buildings:
            filter: { $zoom: { min: 15 } }
            draw:
                polygons:
                    extrude: function () { return feature.height > 20 || $zoom >= 16; }
Quick checkpoint: let’s open up the index.html file and take a peak at the application. If all goes well, you should be seeing the following:
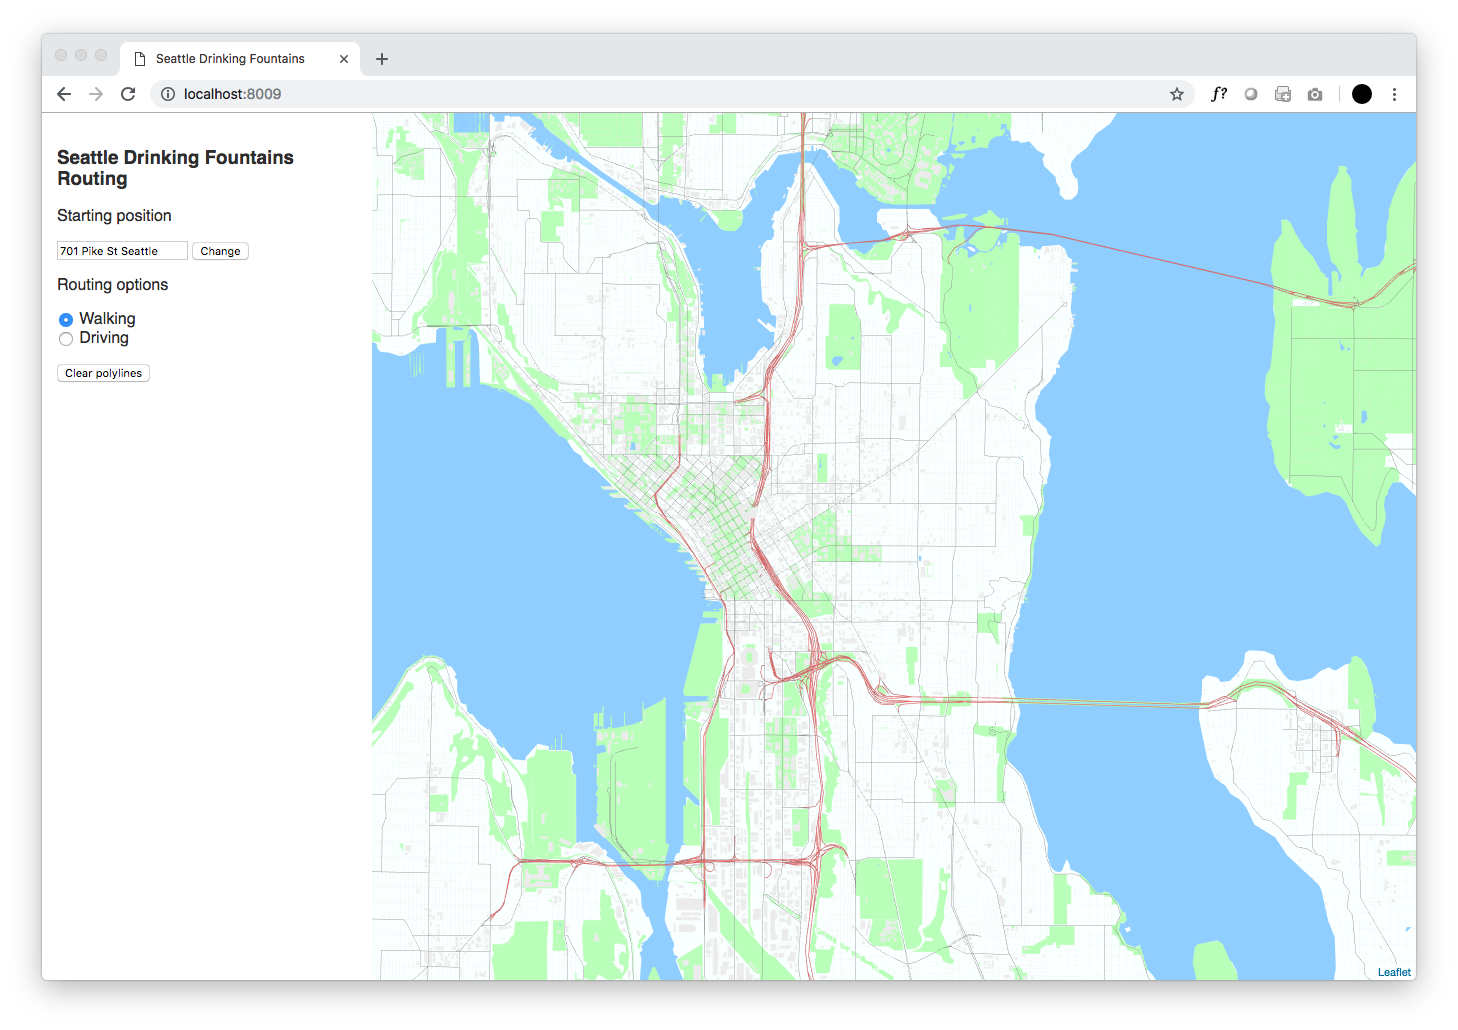
You may need to set up a local server in order for the map to render properly. For example, on a mac, you can try something like:
python -m SimpleHTTPServer 8888
Adding drinking fountain data to the map
Duration is 5 min
Now that the map is configured, let’s add the drinking fountain data to it from the XYZ Space.
To do this, we’ll be adding a new source and layer to Tangram’s scene.yaml file, just like we would do with any other cartography feature.
Inside of sources:, add the following:
fountains:
     url: https://xyz.api.here.com/hub/spaces/XYZ-SPACE-ID/tile/web/{z}_{x}_{y}
     type: GeoJSON
     url_params:
         access_token: XYZ-TOKEN
Be sure to replace XYZ-SPACE-ID and XYZ-TOKEN with your space’s ID and your account’s token, respectively. Remember, you can find your account’s token by running here xyz token in the command line.
Next, inside of layers:, add the following:
fountains:
    data: {source: fountains}
    draw:
        points:
            color: purple
            size: 15px
            interactive: true
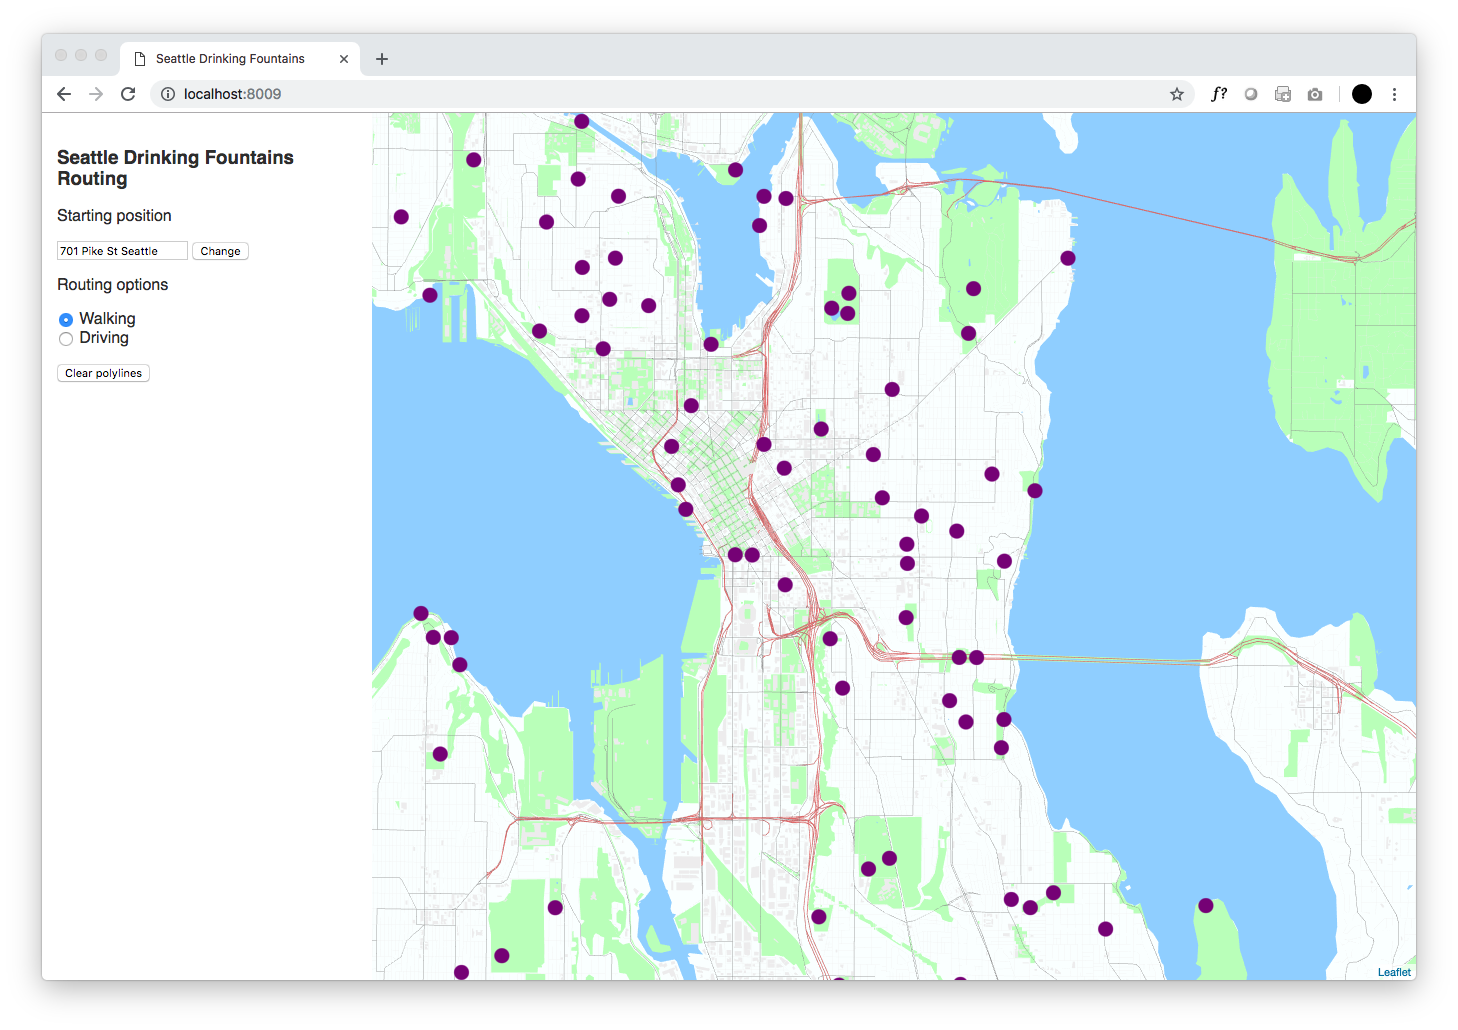
First, we added the data source inside of the sources section. Then, we configured the fountains dataset as a layer inside of layers. Ensure that interactive is set to true. This will be important when we try to interact with the data inside on the map.
If you are curious about how the Tangram scene file works, I recommend taking a look at the official documentation.
Now, let’s take a look back at our map. Refresh the page and you should see the map populated with purple markers!
Adding geocoding capabilities to the map
Duration is 5 min
In our application’s interface, we enable the user to input a starting location for the routing to a drinking fountain. The input takes in addresses, which is easy for us humans to understand. However, maps and services built on top of maps require coordinates instead of addresses. In order to transform addresses to coordinates, we must geocode them. Luckily, HERE has a REST service to do exactly that.
Add the following to index.js:
async function geocode(query) {
   const url = `https://geocoder.api.here.com/6.2/geocode.json?app_id=${here.id}&app_code=${here.code}&searchtext=${query}`
   const response = await fetch(url);
   const data = await response.json();
   return await data.Response.View[0].Result[0].Location.NavigationPosition[0];
}
The function geocode() takes in a parameter, query, and pumps it through the HERE Geocoder API, and then returns a latitude and longitude object in the form of:
{
   Latitude: Number,
   Longitude: Number
}
Adding routing capabilities to the map
Duration is 5 min
We now have two points:
- the starting location specified by the user in the input form (and then geocoded)
- the location of a particular drinking fountain in the XYZ Space (the user will click on this)
This means we can move on to the routing function. Add the following method to index.js:
async function route(start, end) {
   const mode = document.querySelector('input[name="routing-mode"]:checked').value;
   const url = `https://route.api.here.com/routing/7.2/calculateroute.json?app_id=${here.id}&app_code=${here.code}&waypoint0=geo!${start}&waypoint1=geo!${end}&mode=fastest;${mode};traffic:disabled&routeattributes=shape`;
   const response = await fetch(url);
   const data = await response.json();
   return await data.response.route[0];
}
This function takes in two sets of coordinates (start and end) and returns an object with routing information. Since we would like shape information of the route, we added on &routeattributes=shape onto our request URL. For additional routing features and parameters, be sure to check out the Routing API documentation.
Putting it all together
Duration is 10 min
Now that we have our map, geocoding function, and routing function complete, let’s start tying it all together with some interactivity.
Insert the following after the map initialization in index.js:
let startCoordinates = '';

document.getElementById('clear').onclick = clearMap;
document.getElementById('change-start').onclick = addStartingMarker;
addStartingMarker();
The variable startCoordinates will be the variable storing the coordinates of the starting position of the route. This variable can be updated by the user through the input form. This variable is currently an empty string, but will be assigned once addStartingMarker() is called upon map load.
Again, insert some additional code in index.js:
async function addStartingMarker() {
   clearMap();
   const startAddress = document.getElementById('start').value;
   startCoordinates = await geocode(startAddress);
   const startingCircle = L.marker([startCoordinates.Latitude, startCoordinates.Longitude], {alt: 'start'}).addTo(map);
}

function clearMap() {
   map.eachLayer((layer) => {
      if (!layer.hasOwnProperty('_updating_tangram') && !layer.options.hasOwnProperty('alt')) {
         map.removeLayer(layer);
      }
   });
}
addStartingMarker() is a function to add the starting marker to the map. Anytime the change button next to the input form is clicked, this function will update the marker’s position. This function also calls geocoding function to translate the input form’s address to coordinates.
clearMap() is a helper function for clearing lines on the map. This function is executed when the Clear polyline button is clicked by the user. This function will only clear out polylines from the map; the starting marker and the Tangram layer will not be removed from the map.
Finally, add the last block of code to index.js:
async function onMapClick(selection) {
   if (selection.feature) {
      const endCoordinates = `${selection.leaflet_event.latlng.lat},${selection.leaflet_event.latlng.lng}`;
      const routeData = await route(`${startCoordinates.Latitude},${startCoordinates.Longitude}`, endCoordinates);
      const shape = routeData.shape.map(x => x.split(","));
      const poly = L.polyline(shape).addTo(map).snakeIn();
   }
}
Summary
Duration is 2 min
Congratulations! You’ve completed this tutorial.
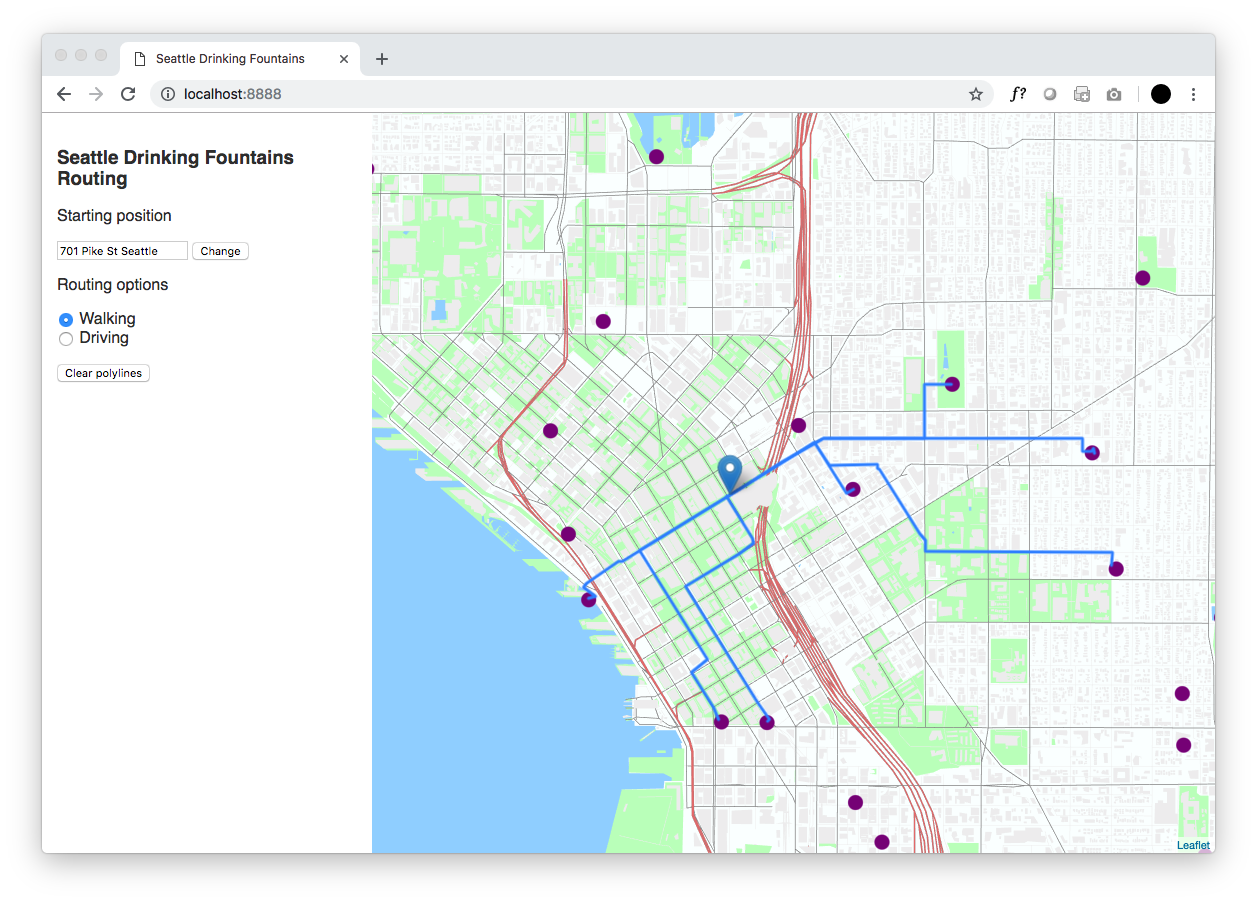
Your final result should look like:
You may be wondering why Leaflet and Tangram were used in this tutorial, as opposed to the HERE JavaScript API. HERE XYZ is all about interoperability with 3rd party and open source tools, so we wanted to provide an example of XYZ Spaces and Leaflet and Tangram. HERE XYZ can be used with any vector tile renderer of your choice.
In this tutorial, you’ve learned how to:
- create XYZ Spaces and upload data with the HERE command line interface.
- transform addresses to coordinates with the HERE Geocoding API.
- create routing requests with the HERE Routing API.
- develop interactive mapping applications with Leaflet and Tangram.
- and navigate to nearby Seattle drinking fountains!
This is just a basic example of what can be done with HERE Location Services and XYZ, take a look at the HERE Developer blog to see more examples of creative and useful applications of HERE Location Services and XYZ.
Appendix: full code samples
index.html
<html lang="en-us">

<head>
   <meta charset="utf-8">
   <meta http-equiv="Content-Type" content="text/html; charset=utf-8">
   <meta name="viewport" content="width=device-width, initial-scale=1.0, maximum-scale=1.0, user-scalable=no">
   <title>Seattle Drinking Fountains</title>

   <link rel="stylesheet" href="style.css">

   <script src="https://unpkg.com/leaflet@1.0.1/dist/leaflet.js"></script>
   <script src="https://unpkg.com/tangram/dist/tangram.min.js"></script>
   <script src="https://cdn.jsdelivr.net/gh/IvanSanchez/Leaflet.Polyline.SnakeAnim/L.Polyline.SnakeAnim.js"></script>
   <link rel="stylesheet" href="https://unpkg.com/leaflet@1.0.1/dist/leaflet.css" />
</head>

<body>
   <div id="control">
      <h3>Seattle Drinking Fountains Routing</h3>
      <p>
         Starting position
      </p>
      <input type="text" value="701 Pike St Seattle" id="start" />
      <button id="change-start">Change</button>
      <p>
         Routing options
      </p>
      <form id="routing-mode" action="">
         <input type="radio" name="routing-mode" id="walking" value="pedestrian" checked> Walking<br>
         <input type="radio" name="routing-mode" id="driving" value="car"> Driving
      </form>
      <button id="clear">Clear polylines</button>
   </div>
   <div id="map"></div>
   <script src="index.js" type="text/javascript"></script>s
</body>

</html>
index.js
const here = {
   id: 'HERE-APP-ID',
   code: 'HERE-APP-CODE'
};

const map = L.map('map', {
   center: [47.608013, -122.335167],
   zoom: 13,
   layers: [
      Tangram.leafletLayer({
         scene: 'scene.yaml',
         events: {
            click: onMapClick
         }
      })
   ],
   zoomControl: false
});

let startCoordinates = '';

document.getElementById('clear').onclick = clearMap;
document.getElementById('change-start').onclick = addStartingMarker;
addStartingMarker();

async function geocode(query) {
   const url = `https://geocoder.api.here.com/6.2/geocode.json?app_id=${here.id}&app_code=${here.code}&searchtext=${query}`
   const response = await fetch(url);
   const data = await response.json();
   return await data.Response.View[0].Result[0].Location.NavigationPosition[0];
}

async function route(start, end) {
   const mode = document.querySelector('input[name="routing-mode"]:checked').value;
   const url = `https://route.api.here.com/routing/7.2/calculateroute.json?app_id=${here.id}&app_code=${here.code}&waypoint0=geo!${start}&waypoint1=geo!${end}&mode=fastest;${mode};traffic:disabled&routeattributes=shape`
   const response = await fetch(url);
   const data = await response.json();
   return await data.response.route[0];
}

function clearMap() {
   map.eachLayer((layer) => {
      if (!layer.hasOwnProperty('_updating_tangram') && !layer.options.hasOwnProperty('alt')) {
         map.removeLayer(layer);
      }
   });
}

async function addStartingMarker() {
   clearMap();
   const startAddress = document.getElementById('start').value;
   startCoordinates = await geocode(startAddress);
   const startingCircle = L.marker([startCoordinates.Latitude, startCoordinates.Longitude], {alt: 'start'}).addTo(map);
}

async function onMapClick(selection) {
   if (selection.feature) {
      const endCoordinates = `${selection.leaflet_event.latlng.lat},${selection.leaflet_event.latlng.lng}`;
      const routeData = await route(`${startCoordinates.Latitude},${startCoordinates.Longitude}`, endCoordinates);
      const shape = routeData.shape.map(x => x.split(","));
      const poly = L.polyline(shape).addTo(map).snakeIn();
   }
}
scene.yaml
cameras:
    camera1:
        type: perspective

lights:
    light1:
        type: directional
        direction: [0, 1, -.5]
        diffuse: .3
        ambient: 1

sources:
    xyz_osm:
        type: MVT
        url: https://xyz.api.here.com/tiles/osmbase/256/all/{z}/{x}/{y}.mvt
        max_zoom: 16
    offices:
        url: https://xyz.api.here.com/hub/spaces/beKRCknC/tile/web/{z}_{x}_{y}
        type: GeoJSON
        url_params:
            access_token: XYZ-TOKEN

layers:
    offices:
        data: {source: offices}
        draw:
            points:
                color: purple
                size: 15px
                interactive: true
    earth:
        data: { source: xyz_osm }
        draw:
            polygons:
                order: function() { return feature.sort_rank; }
                color: '#ddeeee'

    landuse:
        data: { source: xyz_osm }
        draw:
            polygons:
                order: function() { return feature.sort_rank; }
                color: '#aaffaa'

    water:
        data: { source: xyz_osm }
        draw:
            polygons:
                order: function() { return feature.sort_rank; }
                color: '#88bbee'

    roads:
        data: { source: xyz_osm }
        filter:
            not: { kind: [path, rail, ferry] }
        draw:
            lines:
                order: function() { return feature.sort_rank; }
                color: gray
                width: 8
                cap: round
        highway:
            filter:
                kind: highway
            draw:
                lines:
                    order: function() { return feature.sort_rank; }
                    color: '#cc6666'
                    width: 12
                    outline:
                        color: grey
                        width: 1.5
        minor_road:
            filter:
                kind: minor_road
            draw:
                lines:
                    order: function() { return feature.sort_rank; }
                    color: lightgrey
                    width: 5

    buildings:
        data: { source: xyz_osm }
        draw:
            polygons:
                order: function() { return feature.sort_rank; }
                color: lightgrey
        3d-buildings:
            filter: { $zoom: { min: 15 } }
            draw:
                polygons:
                    extrude: function () { return feature.height > 20 || $zoom >= 16; }
style.css
body {
   margin: 0px;
   border: 0px;
   padding: 0px;
   font-family: sans-serif;
   color: #333;
}

#map {
   height: 100%;
   width: 100%;
   position: absolute;
}

#control {
   width: 300px;
   height: 100%;
   position: absolute;
   top: 0;
   left: 0;
   background-color: white;
   z-index: 1000;
   padding: 15px;
}